UNITN has made substantial progress towards integrating chemical artificial life with biological systems. In particular we were able to demonstrate the introduction of chemical droplets and chemical alginate capsules to living biofilm and MFCs, and the directed transport and deposition of living cells using the chemotactic droplets.
UGL focussed on performing high-through experiments with droplets. This allowed us to develop a comprehensive dataset on droplet chemistry to allow for better models. Furthermore, we were able to optimize droplets for specific behaviours and to co-evolve droplets composition with the composition of their environments.
Biofilm and droplet interaction
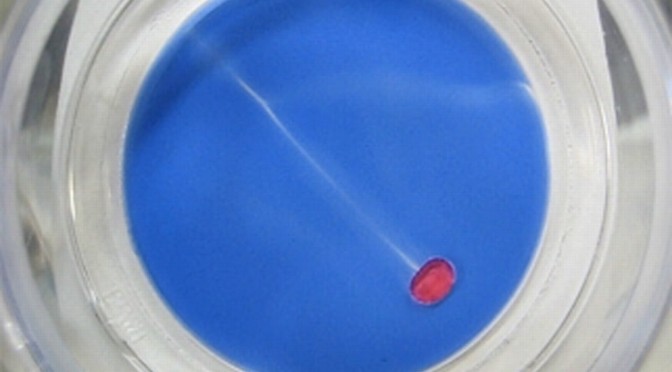
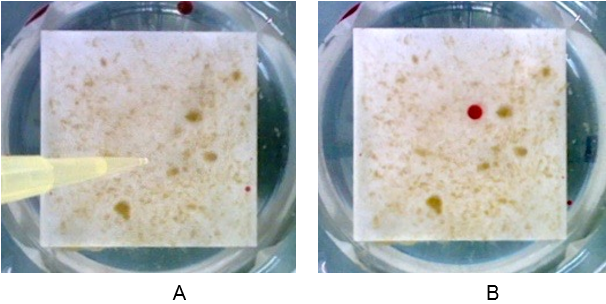
Biofilm cultivation was performed on ceramic tiles of size 4 cm x 4 cm for approximately 30 days. The tiles were placed in a flume with low COD concentrations to mimic biofilm growth in a natural environment, such as rivers. After sufficient biofilm growth, the ceramic tiles were transferred from the flume into a petri dish containing 5 mM decanoate solution of pH 11. A chemical droplet of 20 µl 1-decanol with Oil Red O was added to the edge of the system and then a chemical salt gradient was used to induce chemotactic movement across the biofilm. The droplet was able to sense and to move under these conditions (Figure 1) but with considerable difficulty as the droplet movement was physically hampered by the biofilm (movie, https://youtu.be/ir9BYkC4T-Q ). Afterwards we did not detect any change in the biofilm structure as the result of the droplet position or path. However, after 28 days a general deterioration of the biofilm was apparent under these conditions (Figure 2).
Alginate and biofilms
Since we detected either no effect (decanol) or negative affect (chloroform or decanoate solution) of chemical droplets on the biofilm, we performed some experiments with alginate that we assumed would be more bio-compatible.
Alginate capsules were prepared by dissolving sodium alginate (3% w/v) in tap water. Two types of capsules were prepared, containing different concentrations of glucose (0,1% and 1% w/v). The capsules were extruded using a 20 ml syringe with a 0,8 mm gauge needle into a calcium chloride (CaCl2) 1% w/v solution. The capsules were cross-linked for 1 minute and then CaCl2 solution was poured away. The capsules were dehydrated for two hours at 100 °C. After dehydration the capsules were placed on the surface of biofilm growing on ceramic tiles (4x4cm) in continuous flow of tap water. Biofilms were then covered with a layer of tap water. For the first five days of the experiment, each sample was supplied with 10 ml of 0.1 M sodium citrate solution at 1-day intervals as a potential nutrient but also to chelate the calcium ions and slowly dissolve the alginate capsules. This releases the stored glucose for further biofilm growth.
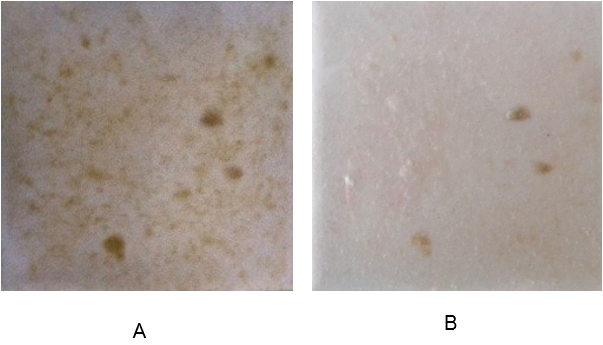
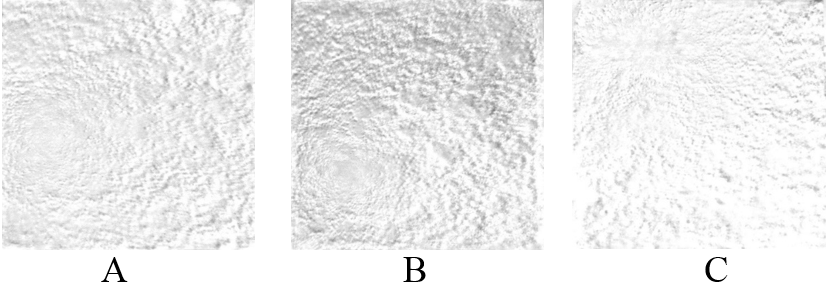
On the sixth day, tap water and the residuals of dissolved beads were removed and optical images of the biofilms were taken using a Nikon camera. The images were then processed, using Fiji software. The blue color channel of the image, showing the highest sensitivity for biofilm, was selected and inverted to perform the analysis. The image analysis revealed that introducing alginate capsules impregnated with glucose resulted in increased growth of the biofilm, as expected (Figure 3 A and B). The images represent the amount of biomass increase over five days. The darker the image, the more biofilm formed, with the higher amount of glucose inducing the most growth (Figure 3 B). The sodium citrate control (Figure 3 C) revealed the negligible effect of sodium citrate on the growth of biofilm in the experimental period of 5 days.
Introducing the alginate capsules carrying nutrients into the MFCs
To ensure the stable power output of the anodic biofilm and to investigate the potential delivery mechanisms for the compounds of interest, alginate capsules were introduced into the MFCs operating in fed-batch mode. while the open circuit voltage was monitored continuously.
To prepare the capsules containing the compounds of interest, sodium alginate was dissolved into concentrated (100x) nutrient solution and used to produce 4 types of alginate capsules: capsules containing only nutrient solution, capsules supplied with 1% w/v glucose, acetate or iron sulfate. Once prepared, the capsules were washed with deionized water, dehydrated and introduced to the MFCs. Glucose, acetate and nutrient capsules were introduced in the anodic chamber and iron sulfate capsules into the cathodic chamber. Iron enriched beads, as redox-mediator for electron uptake from the cathode, were introduced to MFC1 one week before introducing the beads carrying nutrients and carbon sources. For the MFC2 the iron beads were introduced simultaneously with the nutrient-containing beads.
The final experimental setup was as follows:
MFC1: glucose beads anode, iron sulfate cathode;
MFC2: acetate beads anode, iron sulfate cathode;
MFC3: nutrients beads anode.
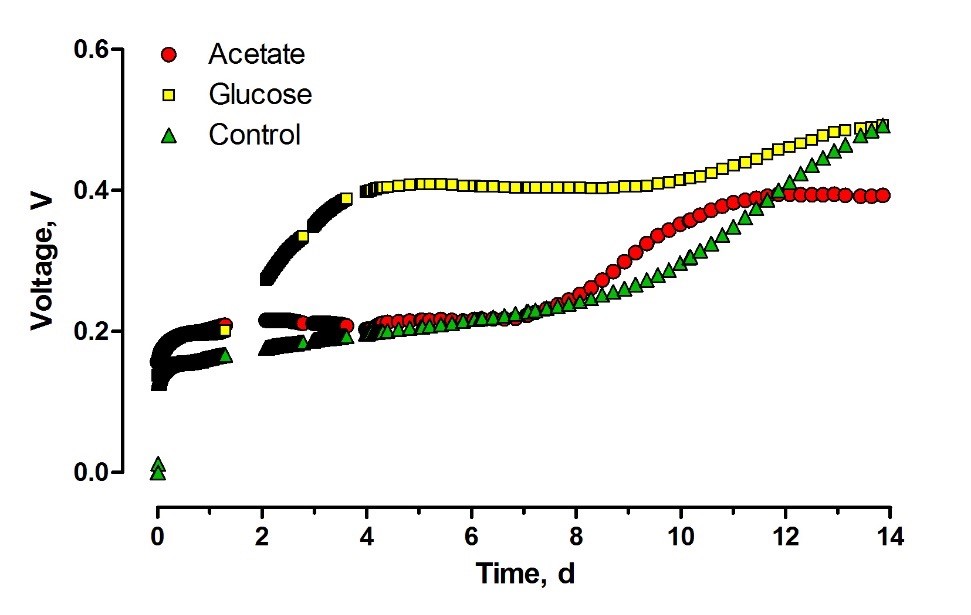
Introducing the capsules containing glucose as a carbon source resulted in an increase of the OCV as seen in Figure 4. The effect of the capsules started two days after they were introduced into the system. Two days of adaptation period, which is relatively long for such an easily accessible substrate, suggests that glucose was slowly released into the feedstock. Nevertheless, the lag-phase observed for acetate suggests that the complete release of this substrate from alginate capsules took place before the bacterial cells started to utilize the first portions of nutrient diffused from the capsules.
Integration of the robotic, chemical and biological platforms
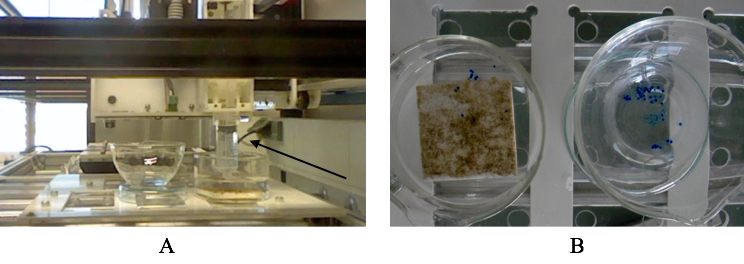
The EvoBot platform was used to either remove or distribute the dehydrated alginate capsules over the biofilm surface and outside the growth area (as control), see Figure 5 and movie D.3.3.3 (https://youtu.be/9mShxqo7D4U). The same principle can be adapted to introduce the capsules into the anode or cathode chambers of the MFCs.
Transport of living cells in motile droplets
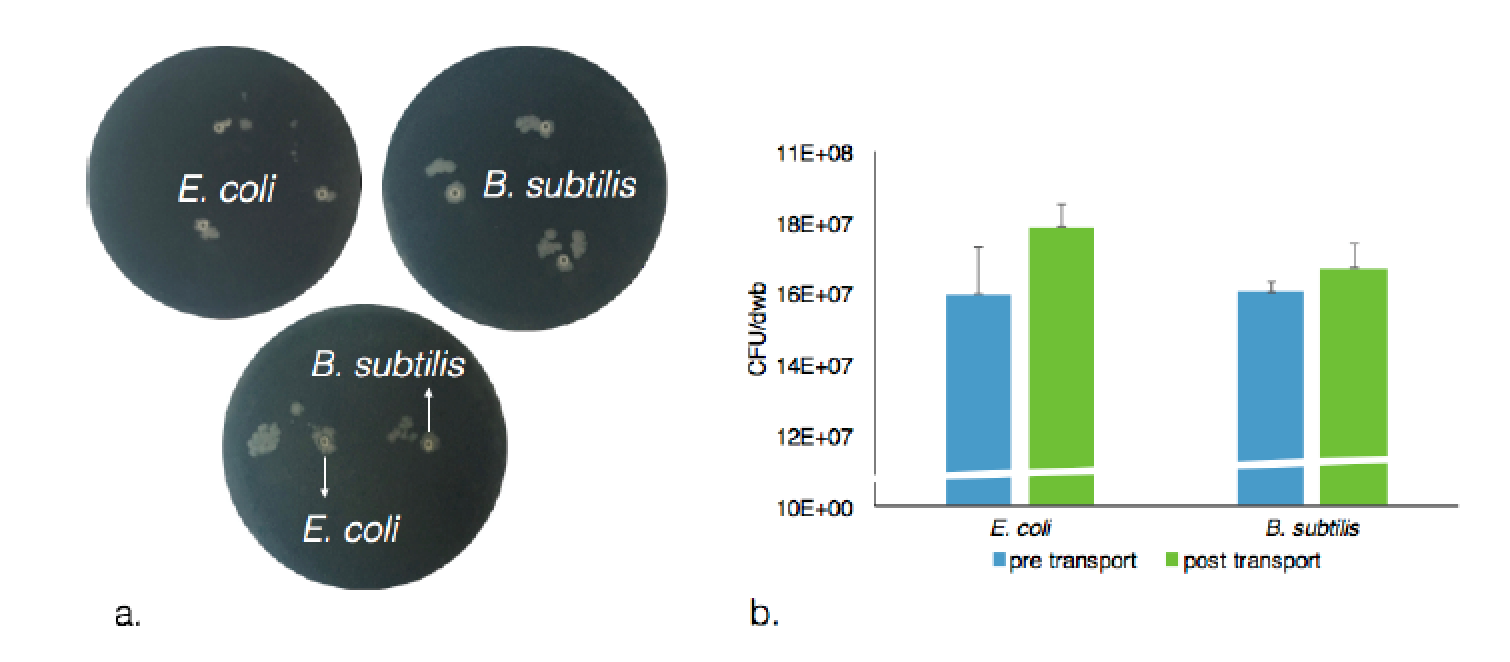
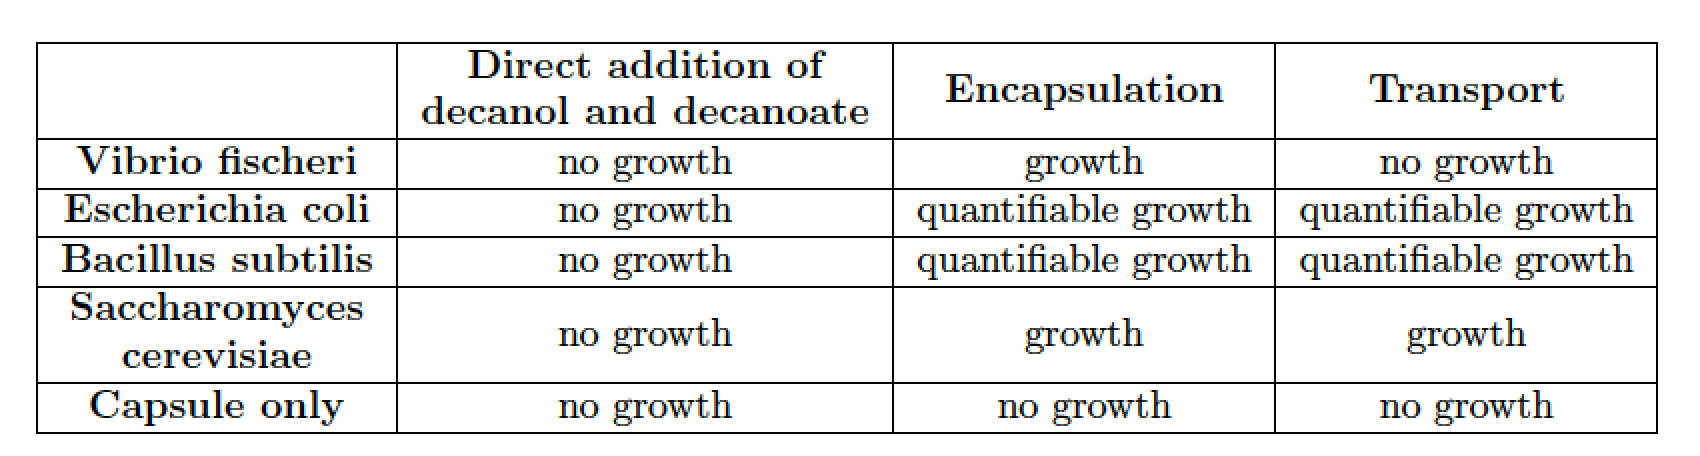
The rather extreme conditions that favor chemotactic droplet motion (high pH, high surfactant concentration, non-aqueous phases) are antagonistic to cell viability. Therefore, the first step of integration involved the use of alginate hydrogel capsules as temporary storage units for the living cells as cargo to be transported. We developed a system to quantitatively and reproducibly adjust the hydrophobicity of the hydrogel. This was accomplished by titrating in an amount of surfactant during the hydrogel crosslinking step. This resulted in controllable hydrophobicity of the hydrogel surface. For example, using 20 mM decanoate as surfactant we were able to produce encapsulated cells that were stably placed in 1-decanol droplets for transport. In addition, the capsule cargo with cells can then be dissolved and viable cells recovered from the experiment, see Figure 6. A summary of all cell types tested for encapsulation in hydrogel and transport is in Table 1. Tests regarding asepsis and sterility were also successfully accomplished. Using such an approach we were able to show the droplet-directed transport of viable living cells as an interface between the living and chemical systems.
Modelling and expanding the droplet chemical space
Following previous work on droplet chemistry we proceeded to model the resulting chemical space with different machine learning algorithms. We collected all the experiments performed and analysed them with respect to all behavioural measures for the droplets. This allowed us to study more aspects of the oil formulation to physical properties of the oil droplets and the relation between them. To do this we built a main dataset with ca. 10,000 experiments spanning a variety of experimental input parameters. Such dataset has never been built before. It will empower researchers in various disciplines to: 1) study the relation between oil formulation and behaviour, 2) test and develop models of the physicochemical relationship of oil in water systems and the Marangoni effect, 3) use a realistic dataset for developing and tuning algorithms for autonomous exploration of chemical spaces. As seen in figure 7.

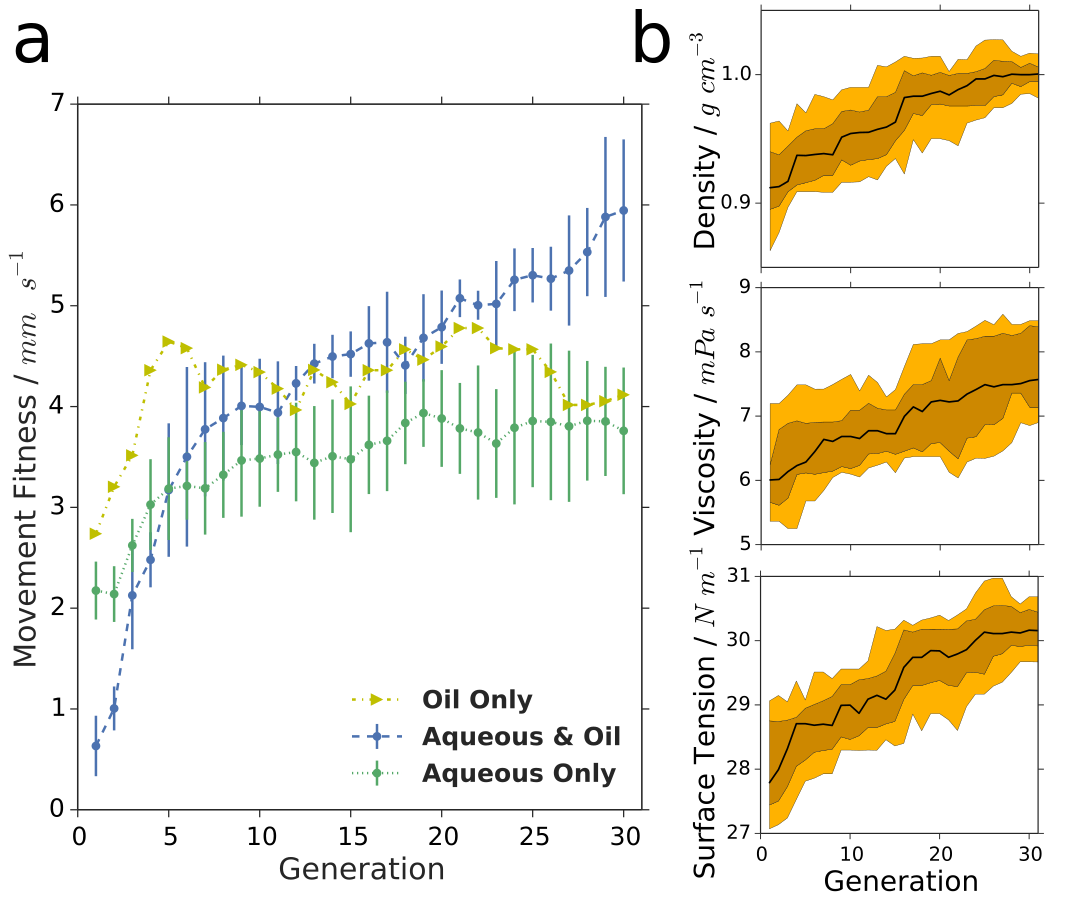
To further expand the scope of droplet behaviours we have begun addressing an often neglected part of droplet systems, the aqueous phase. We have added to the parameter space several different types of modifiers in the aqueous phase such as cationic, non-ionic and zwitterionic, as well as inorganic materials, that greatly increase the prospects for interesting droplet behaviours. A major question that can be answered with this system is whether the expanded space will allow the optimization of the system to reach higher fitness points in the landscape although the larger space should make it harder to search. By expanding our droplet system to include the aqueous phase, using different surfactant types and modifiers, various droplet behaviours were observed, see Figure 8. The increased speed of the droplets accessible when both phases (eight parameters) were optimized together (over oil or aqueous phase in isolation) sheds light on the complexity and intertwined physicochemical properties of our droplet system. The larger parameter space gave a far lower first-generation fitness than either four-parameter space, with the fitness subsequently rising rapidly during evolutionary exploration, showing that for systems such as ours, such an increase in parameter space can produce impressive results with a genetic algorithm.
Adaptive Droplet Evolution
In order to investigate the influence of the environment on the evolution of a population of droplets we develop an approach that uses rapid prototyping tools to design and manufacture hardware that embodies an evolutionary experiment based on a genetic algorithm involving selection of the artificial genotypes. The scheme of the system can be seen in Figure 9. This approach allows us to define the environment as an experimental variable, an aspect that tends to be disregarded in artificial evolutionary studies outside computer simulation.
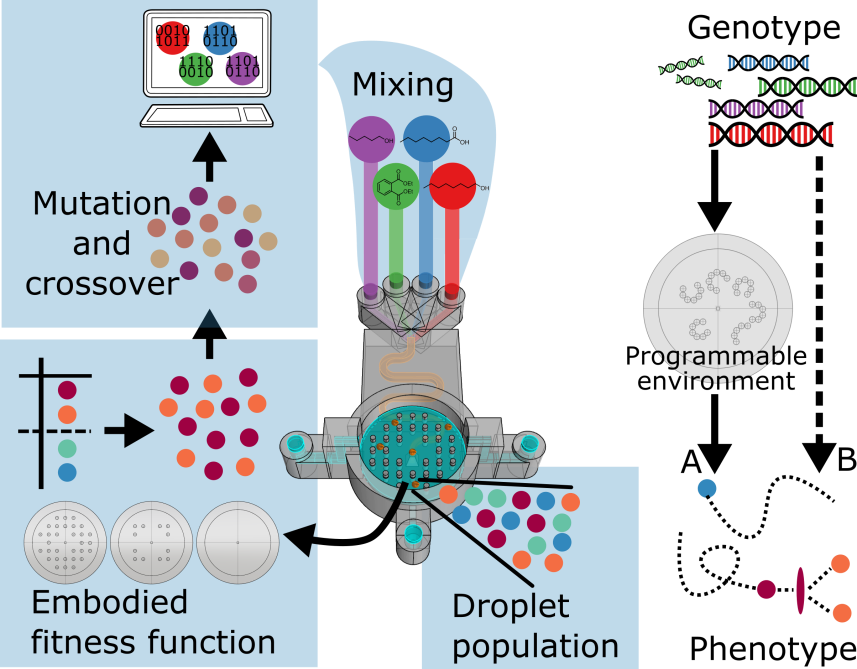
Therefore, we are able to modify the environment and study its effect on individuals during evolutionary experiments, emulating how a population of entities responds to sudden environmental changes and demonstrating that evolutionary selection can occur on non-living very simple chemical entities. Furthermore, we can observe how these changes act as a population filter – reshaping and biasing artificial ‘natural’ selection.
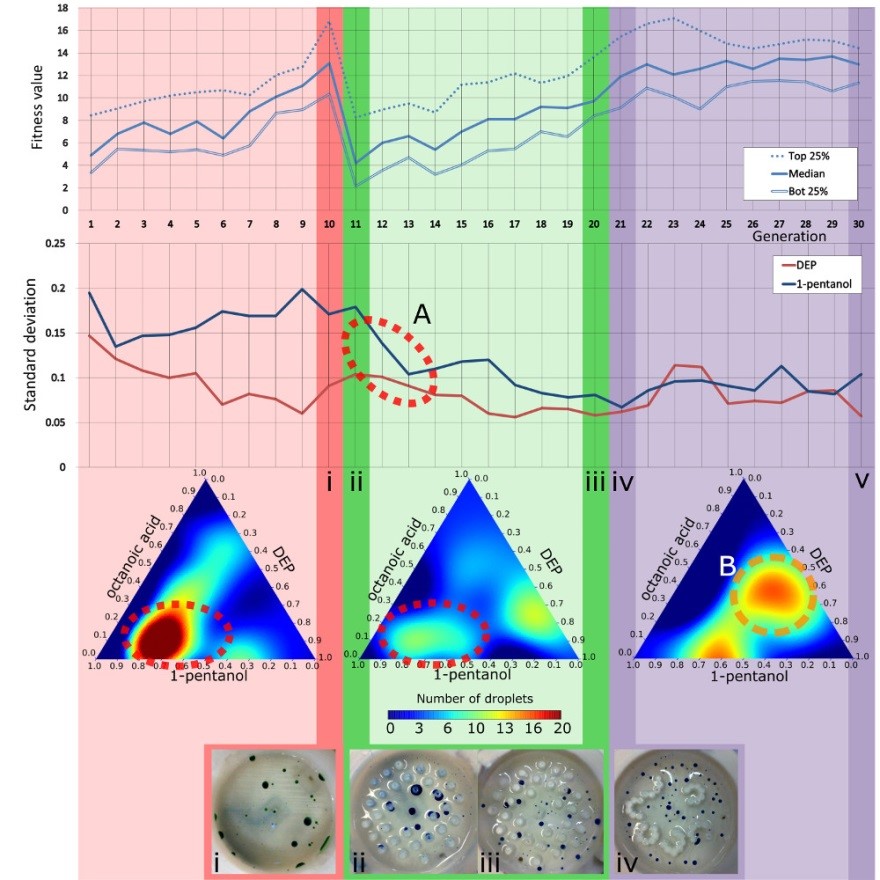
In order to emulate how rapid environmental changes affect evolution, a GA run was performed where the initial 10 generations used the empty arena, the following 10 generations used the pillared arena, and the last 10 generations used the L-system arena, see Fig. 10. After the first environmental change, the fitness of the droplets population dropped by nearly half, proving that our environmental modifications had an impact over the droplet’s behaviours. In fact, we observed a ‘filtering’ effect due to the environmental change, as indicated by the fitness landscape models where the optimal genotypes of the pillars environment were a subset of the genotypes selected in the first environment (Fig. 10, bottom ternary plots, highlighted as “A”). In contrast, the second change of arena introduced a different effect on the evolution dynamics, because the third environment resulted in a fitness landscape where new sub-optimal behaviours appeared (highlighted as “B” with an orange broken circle in Fig. 10) where no peaks were observed in the first environment.
Important results
- Chemical droplets were able to affect both the growth of biofilm and the voltage output of MFCS.
- Chemical droplets were designed for directional transport and deposition of living cells.
- Several dynamic characteristics of chemical droplets were thoroughly explored such as movement, vibration, and division.
- The potential co-evolution of the chemical composition of droplets and their environment explored.