Biofilms are the dominant form of microbial life on Earth. Inside the biofilm matrix buildup of extracellular polymeric substances (EPS) microorganisms (e.g., bacterie, fungi, algae) are embedded. Microorganisms and EPS form a three-dimensional (3D) network interacting with the surrounding fluid. Within this workpackage the complex biofilm structure will be visualized and characterized in 3D.
In EVOBLISS biofilms were used as biologically active systems. Due to their metabolic activity (substrate turnover) electrical energy is produced when cultivated in microbial fuel cells (MFC). The performance (e.g., electrical power output) is coupled to the biofilm structure and cultivation conditions. KIT thus focused on the structural characterization of biofilms developing in mini-fluidic flow cells and MFC. Through three-dimensional visualization a comprehensive structural characterization should be achieved to allow for the designing of structurally optimized biofilms. The biofilm work had the following objectives:
- Set-up a cultivation experiment that allows a detailed structural characterization of the biofilm development inside a MFC.
- Correlate biofilm structure and fluid-structure-interaction with the output power (performance) of the MFC.
- Develop a “printing” inoculation strategy to enhance the biofilm development in new 3D printed MFCs.
Biofilm cultivation
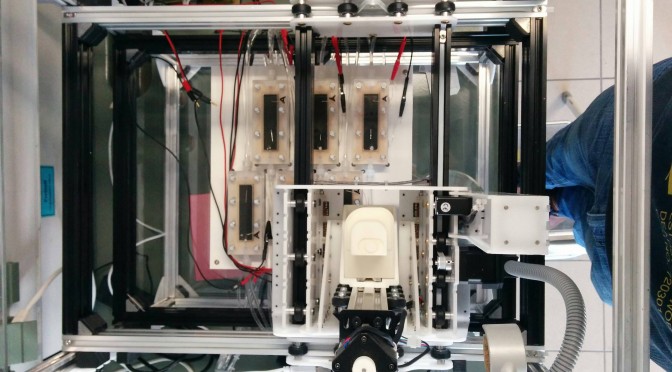
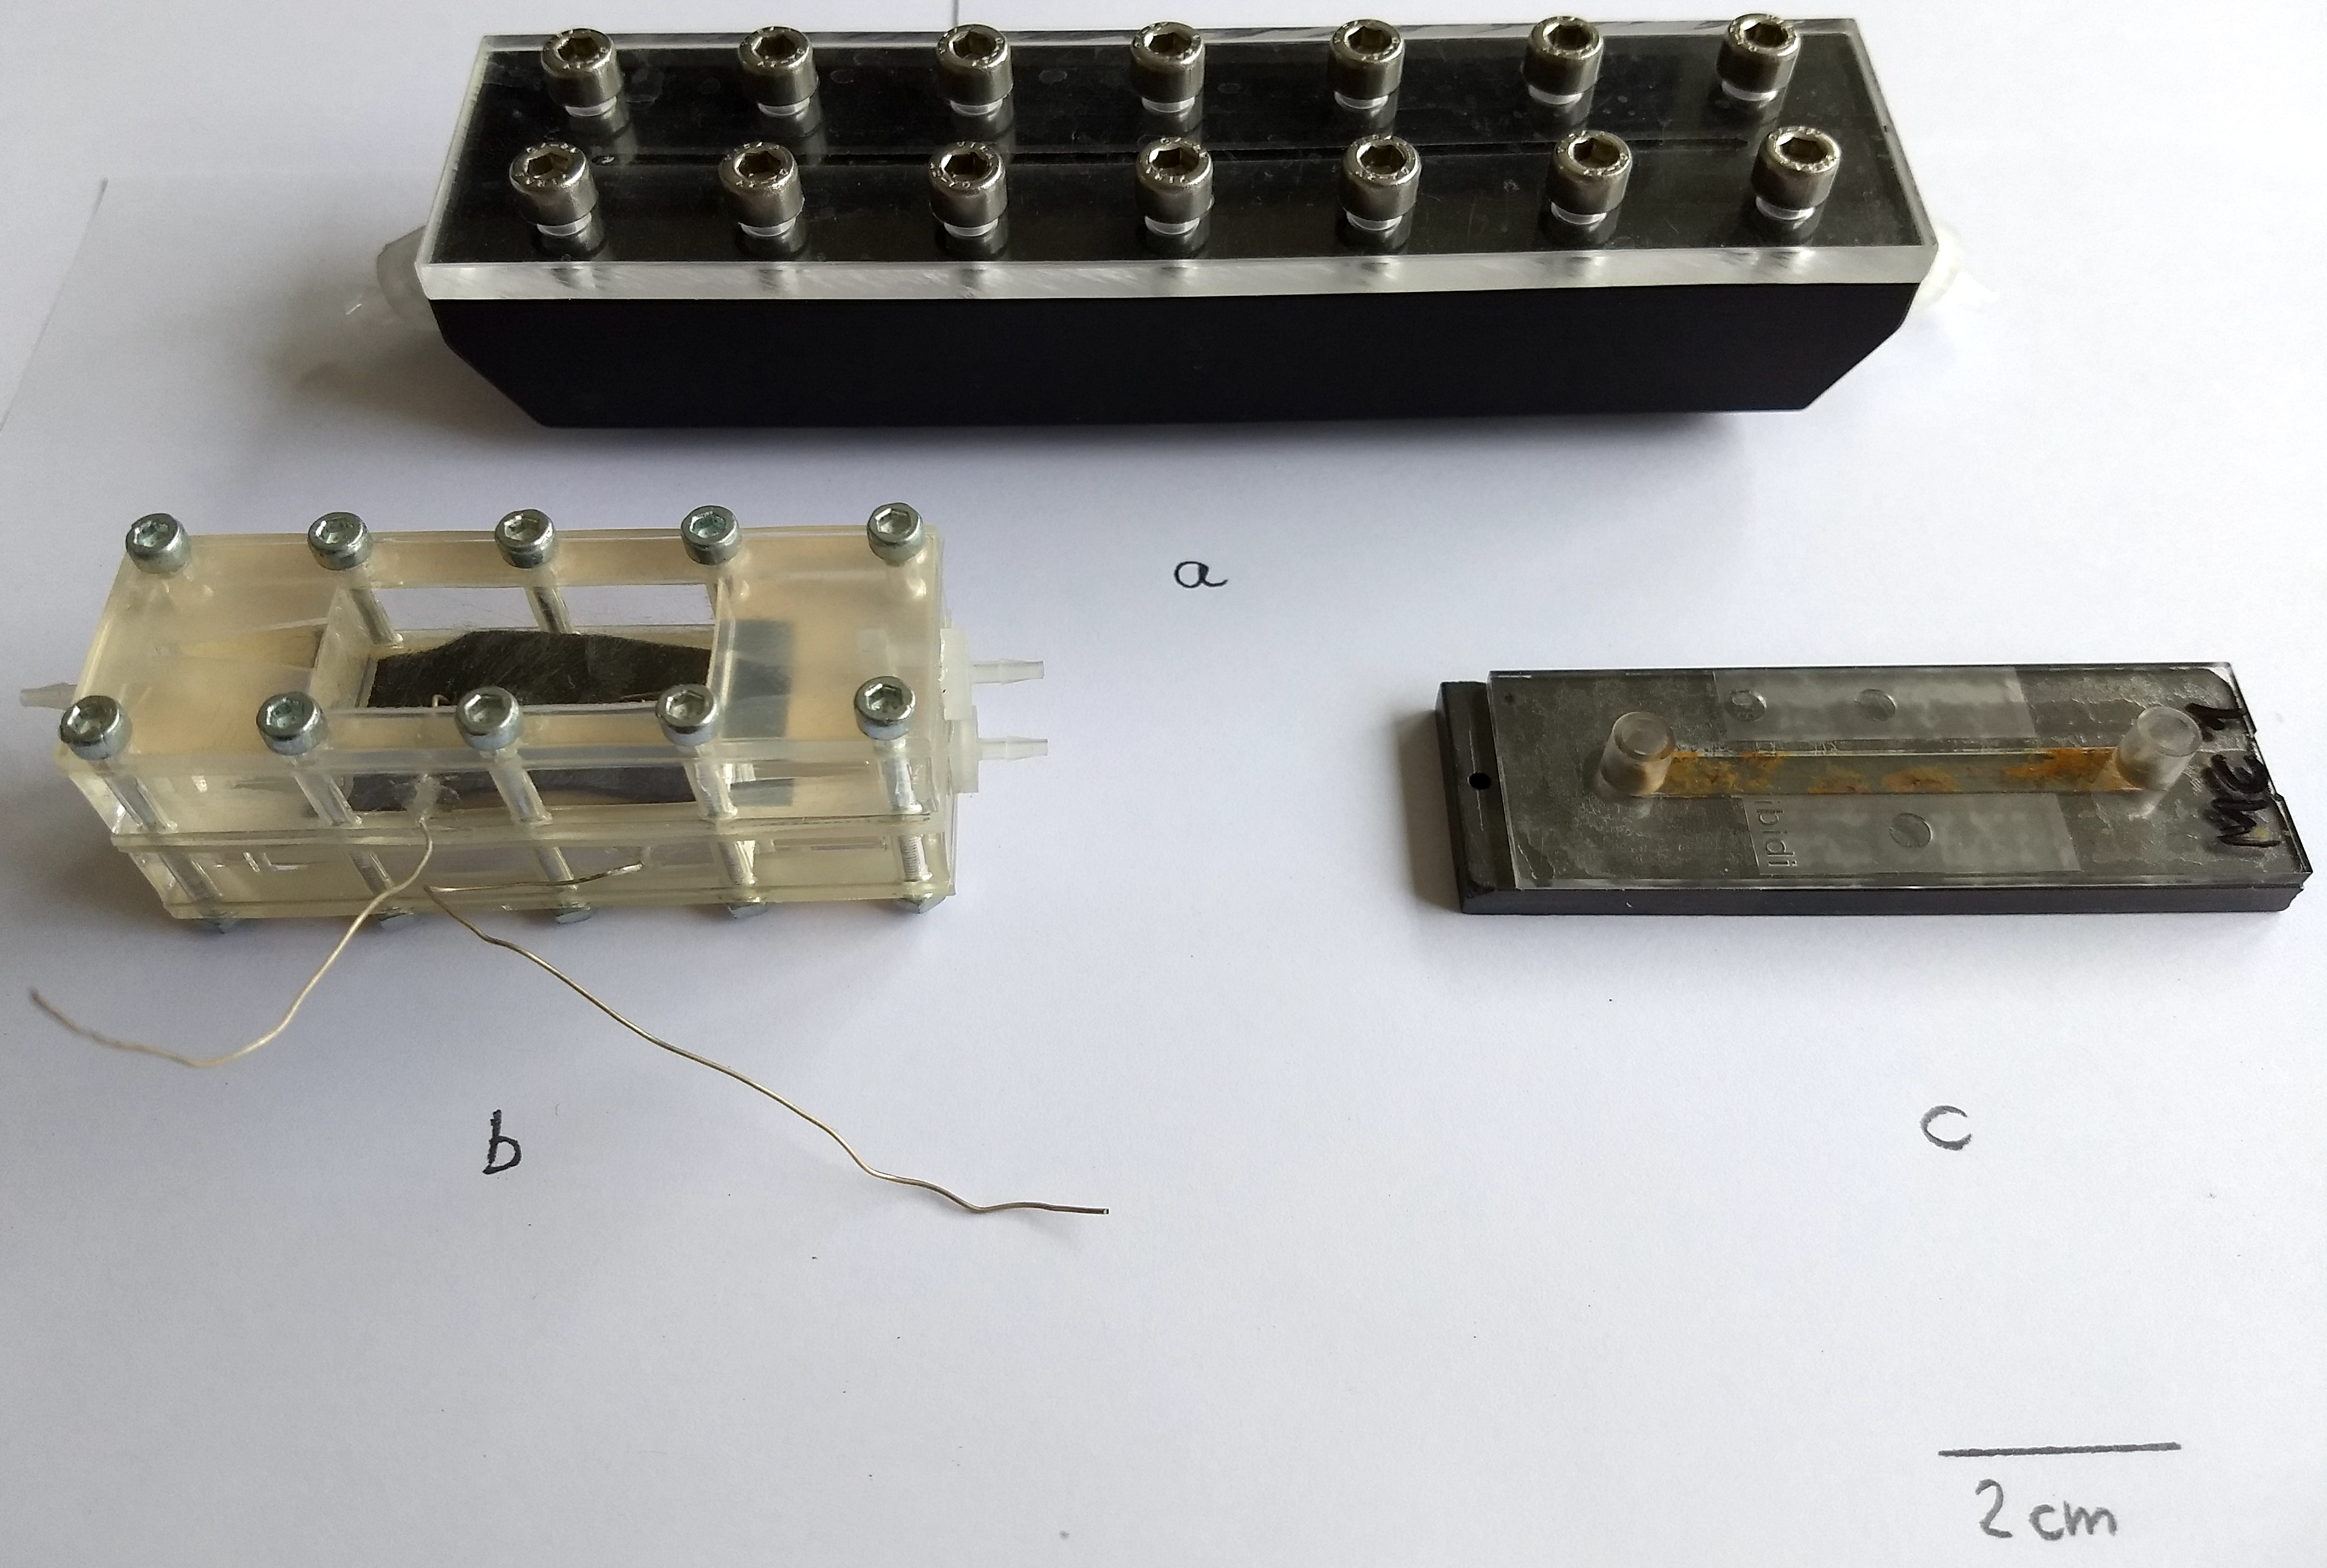
Biofilms were cultivated in different lab-scale setups. Flow cells/MFC were installed on the experimental layer of the EvoBot platform. Experiments were automated as much as possible. In the majority of the experiments heterotrophic (i.e., see Table 1 in D5.1 and Table 1 in D5.3) mixed-species biofilms were used. Figure 1 shows a photograph of flow cells/MFC applied. Initial experiments were conducted in mini-fluidic flow cells (see 3.4.1a) to set-up and optimize biofilm cultivation conditions, visualization by means of optical coherence tomography (OCT) as well as to develop image analysis routines. Figure b shows the MFC developed together with UWE. UWE also manufactured those cells. Using these cells different substrates and load conditions were tested (e.g., glucose, acetate, and L-phenylalanine) to determine the growth conditions leading to optimized MFC performance (e.g., electrical power output). Anodes (feed) and cathode (aerated water) were made from carbon veil. For task 5.3 a ‘printing inoculation’ scheme was proposed, adapted/optimized, and realized. Proof-of concept experiments were conducted using a simplified MFC setup employing cells depicted in Figure 1c.
Estimation of optimal growth conditions through 3D biofilm imaging, image quantification, and determination of MFC power curves
OCT is a non-invasive, in situ imaging modality well suited to assess the three-dimensional structure of biofilms. It appeared in biofilm research about a decade ago and thus EVOBLISS remarkably promoted OCT for monitoring biofilm development. Structural parameters such as mean biofilm thickness, roughness coefficient, fraction of uncovered area of the substratum, and porosity helped to estimate optimal growth conditions with respect to MFC performance. Moreover, an Arduino microcontroller-based resistor cascade was developed to determine and operate the MFC at or at least near the maximal power point.
Comparison of substrates L-phenylalanine (supposed to be less bio-degradable due to its aromatic component) and acetate (known to be easy degradable) revealed differences in the biofilm structure and power characteristics. Acetate fed biofilms out competed L-phenylalanine fed ones. Additionally, an Ohmic resistance of 510 – 1000 Ω was identified to form biofilms with highest electrical power output of approx. 50 µW.
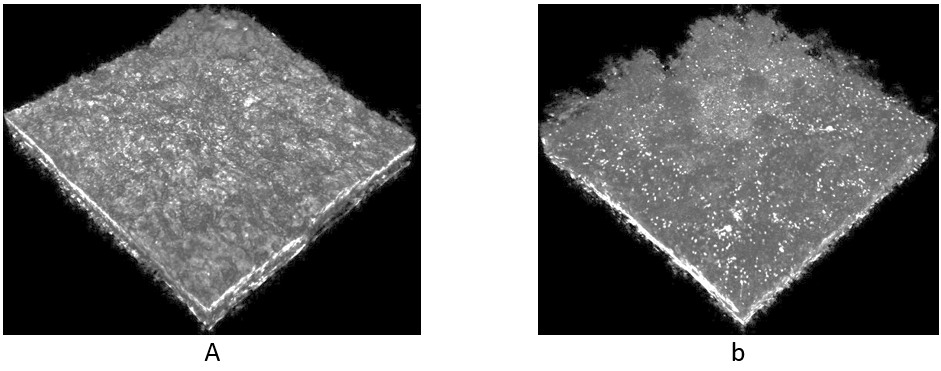
Image analysis of OCT 3D scans (C-scans) revealed, that acetate consuming biofilms developed a mean biofilm thickness of ≈ 200 µm, whereas L-phenylalanine fed biofilms grew ≈ 100 µm thicker (experimental duration 26 days). Moreover, acetate driven biofilms exhibited a smooth bulk-biofilm interface with a roughness coefficient of ≈ 0.45 – 0.8. This fact in conjunction with the supposed lower bio-degradability of L-phenylalanine may explain the low electrical power output of biofilms using L-phenylalanine as substrate. Due to the dynamic changes of the biofilm structure (e.g., balance between biomass accumulation and detachment) it was not possible to identify a set of structural parameters, which uniquely describe the biofilm structure developing under certain cultivation conditions. However, qualitative assessment of structural differences as presented in Figure 2 supports understanding MFC performance.
Because of the high-speed acquisition of xz-planes (≈ 10 – 100 fps; 2D optical sections through the biofilm parallel to direction of flow) OCT allows for the monitoring of biofilm deformation and relaxation at changing shear stress conditions. In EVOBLISS a routine was developed, which enabled us to extract mechanical properties of biofilms. We were thus the first showing, that glucose fed biofilms have a shear modulus of G = 29.7 ± 1.7 Pa and a Young’s modulus of E = 36.0 ± 2.6 Pa, respectively, without destroying the biofilm. Results were published in Blauert F, Horn H, Wagner M. 2015. Time-resolved Biofilm Deformation Measurements using Optical Coherence Tomography. Biotechnol. Bioeng. 112:1893–1905. A second publication extending measurements by applying multi-dimensional modelling is in preparation (Picioreanu C, Blauert F, Wagner M, Horn H. Modeling mechanical properties of biofilms from deformation measurements using optical coherence tomography).
By means of the EvoBot platform such experiments can be automated and performed on a regular basis. Thereby, a structural and mechanical characterization of biofilms can be coupled.
Pre-defining the biofilm structure
By means of OCT the mesoscopic structure of biofilms is assessed at a high level of representativeness and detail. Based on our experimental experience, we supposed that biofilms develop similar structures at similar cultivation conditions. Hence, 3D OCT image datasets could serve as structural templates allowing to pre-define the biofilm structure in order to shorten the lag phase and optimize desired functionalities (e.g., substrate turnover and electrical power output). To pre-define the biofilm structure a printing inoculation should be developed distributing bacteria according to OCT datasets. Due to various limitations and requirements (e.g., bacteria stabilization) of such an approach, a kind of an inverse printing inoculation was realized and tested. Instead of positioning bacteria on the substratum (e.g., anode), an anti-biofilm paint (ABP) developed by the Fraunhofer Institute for Chemical Technology (Pfinztal-Berghausen, Germany) was plotted to prevent attachment and growth of bacteria at defined locations. Cavities in OCT datasets resemble ABP droplets on the surface of the anode. An example pattern is shown in Figure 3. To realize pattern creation, plotting and automated monitoring of the cultivation progress by means of OCT, the EvoBot platform has substantially been evolved. For example, Python scripts have been developed to define patterns through a user-friendly GUI as well as the OCT scanning routine has been automated (semi and fully, respectively; ITU involved).
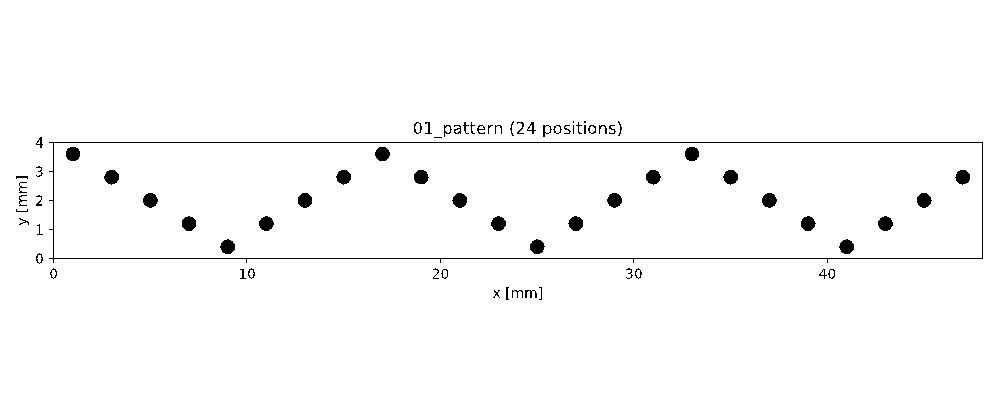
In order to evaluate the printing inoculation approach, proof-of-concept experiments were conducted using artificial patterns of ABP droplets (confer Figure 3). The experimental setup was simplified allowing to focus on the effect of the ABP on biofilm formation and structure. Major difference to previous MFC experiments was the use of a flat/smooth anode made from a conductive polypropylene.
Although ABP droplets do not directly define the biofilm structure (e.g., 3D distribution of biomass), they prevent the formation of biofilm at their location as well as in nearby regions as presented in Figure 4. By implementation of the printing inoculation feature, the EvoBot platform allows for the manipulation of the developing biofilm structure. Thus, the EvoBot platform has definitely the potential to evolve biofilm systems.

Important results
- For the first time determined the mechanical properties of living biofilm non-invasively
- Proof-of-concept of inverted printing inoculation.